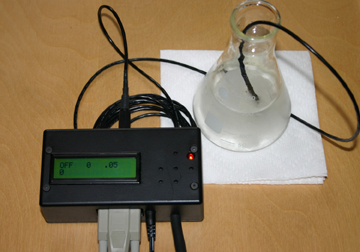
This project involves the construction and programming of an internet-based environmental temperature control system. The hardware consists of a printed circuit board (PCB) that has the ability to read and transmit temperatures from a remote temperature probe to an internet-based application via a serial port connection. The PCB also contains a 15 amp / 120 volt relay that can be opened or closed remotely through a series of computer controlled commands. The benefits of this application are three fold:
1. A log file (below right) allows the user to view and control temperature fluctuations in a remote area, e.g. the inside of an incubator or temperature controlled room, over a given period of time, from an internet connection.
2. The application allows the user to program temperature changes, in a remote area, to match values stored in a data file or retrieved from a data feed. This capability, for example, will allow the user to maintain a constant temperature, or to artifically simulate daily, or seasonal, warming and cooling, or to match temperatures from a data feed.
3. The application has the ability to warn the user of temperature fluctuations that are outside of a given range via a local warning sound, cellular text message, e-mail, etc.
